|
|
Quadratic Inequalities
In this section, I’ll consider quadratic
inequalities. I’ll solve them using the graph of the quadratic
function. I’ll also look at other inequalities, which I’ll solve using
sign charts.
A quadratic function is a function of the form f(x) = ax2+bx+c. The
graph of a quadratic function
is a parabola.
If a > 0, the parabola opens up; if a < 0, the parabola opens down:
You can use the graph of a quadratic function to
solve quadratic inequalities. |
Example. Solve the quadratic inequality x2 − 2x −
3 < 0.
The graph of f(x) = x2 − 2x − 3 opens upward, because the coefficient of
x2 is +1. Since
x2− 2x − 3 = (x − 3)(x + 1),
the roots are x = 3 and x = −1.
Therefore, the graph looks like this:
The original inequality asks for the values of x
for which the parabola is below the x-axis:
| x2 − 2x − 3 < 0 |
| parabola |
below |
x-axis ? |
The parabola is below the x-axis for −1 < x < 3. |
Example. Solve the quadratic inequality −6 − 5x −
x2 ≥ 0.
The graph of f(x) = −6 − 5x − x2 opens downard, because the coefficient
of x2 is −1. Since
−6 − 5x − x2 = −(x2 + 5x + 6) = −(x + 2)(x + 3),
the roots are x = −2 and x = −3.
Therefore, the graph looks like this:
The original inequality asks for the values of x
for which the parabola is below or on the x-axis. The
solution is x ≤ −3 or x ≥ −2.
Warning! You can’t put the inequalities x ≤ −3 and x ≥ −2 together by
writing “−2 ≤ x ≤ 3”. This
says that “−2 ≤ −3”, which is absurd. Rule of thumb: The solution set
occupied two shaded pieces on the
number line, so two inequalities are required to write the answer. |
Example. Solve the quadratic inequality x2 − 4x +
5 ≤ 0.
The graph of f(x) = x2 − 4x + 5 opens upward, because the coefficient of
x2 is +1. The quadratic
formula shows that the roots are complex numbers; this means that the
graph does not intersect the x-axis.
It must look like this:
(I’ve located the vertex of the parabola — it’s at
x = 2 — for reference, but it doesn’t come into this
problem.)
The inequality x2 − 4x + 5 ≤ 0 asks for what values of x the parabola is
below or on the x-axis. Since
the parabola lies entirely above the x-axis, there are no solutions. |
You can also solve inequalities using sign
charts.
1. Make sure the inequality has the form
JUNK > 0 or JUNK < 0.
(≥ 0 or ≤ 0 are also okay.) If there are terms on both sides, add or
subtract terms to move everything
to one side.
2. Combine the terms in JUNK into one piece. For example, add or
subtract fractions over a common
denominator.
3. Factor as much as you can. For example,
write
 as as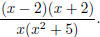
4. Find the values of x for which JUNK = 0 and the values of x for which
JUNK is undefined. These are
the break points for your sign chart.
5. Pick points at random in the intervals determined by the break
points. Plug them into JUNK to
determine whether JUNK is positive or negative on each interval.
You’ll see how to do this in the examples below.
6. Solve the inequality by examining the sign chart. |
Example. Solve 
 for x = −1; for x = −1;
 is undefined for x = 3. Set up a sign chart with x = 3 and x = −1
Let  I pick points
at random in each of the three intervals: −2, 0, 4. (Pick points which I pick points
at random in each of the three intervals: −2, 0, 4. (Pick points which
make the calculations simple!) I plug the points into f; for example,
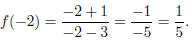
The values I get determine the sign (+ or −) of
 on each interval. I’ve marked the
signs on each interval. I’ve marked the
signs
above the sign chart.
The original inequality asks where  is negative. From the sign chart, the solution is −1 < x < 3.
By the way, it’s purely coincidental that the +’s and −’s alternate —
they don’t have to do that! |
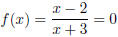
Example. Solve

First, move everything to one side and combine terms over a common
denominator:
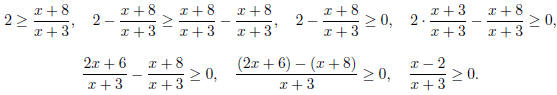
 for x = 2 and for x = 2 and
 is undefined for x = −3. These are the break points on the sign
chart:
The inequality  asks where
  is greater than or equal
to 0. The solution is x ≤ −3 or is greater than or equal
to 0. The solution is x ≤ −3 or
x ≥ 2. |
|