Inequalities and Applications
Interval Notation and Domains
Write the domain of f (x) in set notation,
interval notation and graph the set.
Absolute-Value Equations
and Inequalities
■ Equations with Absolute Value
4.3
■ Inequalities with Absolute Value
Absolute Value
| The absolute value of x, denoted |x|, is defined as: |
(When x is nonnegative, the absolute value of x is x.
When x is negative, the absolute value of x is
the opposite of x.) |
Example Find the solution set:
a) |x| = 6; b) |x| = 0; c) |x| = –2
Absolute-Value Principle for Equations
For any expression X and any positive number p:
a) The solutions of |X| = p must .
b) The equation |X| = 0 is equivalent to the equation
c) The equation |X| = –p has .
d) The equation |X| = |Y| means . |
Example Find the solution set:
a) |2x +1| = 5; b) |3 – 4x| = –10
Example
Given f (x) = 3|x+5| – 4, find all x for which f (x) = 11.
Absolute Value Equations | X | = | Y |
Sometimes an equation has two absolute-values, like| X | = | Y |.
This means that X and Y are the same distance from zero.
If X and Y are the same distance from zero,
then either they’re the same number or they are opposites.
Example
To solve |3x – 5| = |8 + 4x| consider the two cases:
Inequalities with Absolute Value
Our methods for solving equations with absolute value
can be adapted for solving inequalities.
Solve and graph.
|x| < 3 |x| > 3
Absolute Value Equations & Inequalities
Let Stuff be any algebraic expression, then the solutions of:
a) |Stuff | = p are x’s where _____________________.
b) |Stuff | < p are x’s where _____________________.
c) |Stuff | > p are x’s where _____________________.
 |
Example
Solve |3x + 7| ≤ 8. Then graph.
Example
Solve |5x – 2| > 3. Then graph.
Inequalities in Two
Variables
■ Graphs of Linear Inequalities
4.4
■ Systems of Linear Inequalities
Graphs of Linear Inequalities
A linear inequality is formed with <, ≤, >, ≥.
Solutions of linear inequalities are ordered pairs.
Example
Determine whether (1, 5) and (6, –2) are
solutions of the inequality 3x – y < 5.
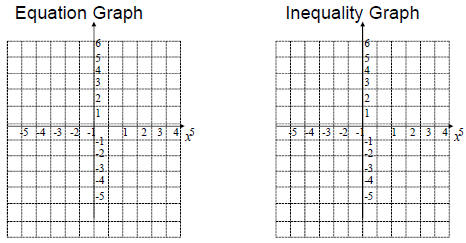
Graphing Linear Inequalities
The graph of a linear equation is a straight line.
The graph of a linear inequality is a half-plane,
with a boundary that is a straight line.
Graphing Linear Inequalities
1) ___________________________________
A. Decide if the line is included in the solutions set or not.
■ < or > means the line is not in solutions – dashed line
■ ≤ or ≥ means the line is a solutions – solid line
B. Make the inequality into an equation (=) and graph it.
2)____________________________________
1. Pick a test point not on the line
2. Plug it into the original inequality and evaluate true or false
3. Shade the side containing the point that make inequality true.
Example
Graph 2x + 5y > 15
Systems of Linear Inequalities
Graph the system x − y ≤ 3 and x + y > 3.
To graph a system of inequalities:
1) graph each inequality and
2) find the intersection of the individual graphs.
Example
Graph -1 < y < 5
 -3 -3
Example
The graph of the system
Example
REVIEW – Six types of problems
| Type |
Example |
Solution |
Graph |
Linear Equation
in one variable |
2x – 8 = 3(x + 5) |
One number |
|
Linear Inequalities
in one variable |
–3x + 5 > 2 |
A set of numbers; an
interval |
|
Linear Equation
in two variables |
2x + y = 5 |
A set of (x,y) pairs;
a line |
|
Linear Inequalities
in two variables |
x + y ≥ 4 |
A set of (x,y) pairs;
a half-plane |
|
System of
Equations |
x + y = 3,
5x – y = –27 |
An (x,y) pair;
one point |
|
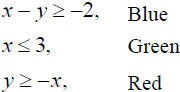
System of
Inequalities |
x – y ≥ 2;
x ≤3; y ≥ – x |
A set of (x,y) pairs;
a region in the plane |
|
|