|
|
Graphs of Rational Functions
Section 4.3 Graphs of Rational Functions
Now, we will graph rational functions. This process is a bit different from the
one in the book ut I think
it is easier to do:
1. Factor, state domain, and THEN reduce.
2. Plot intercepts. For x-intercepts, state whether graph touches (multiplicity
is even) or
crosses (multiplicity is odd) x-axis.
3. Draw vertical asymptotes (the zeros of the denominator).
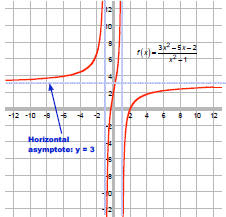
4. Draw horizontal asymptotes:
If deg num < deg denom, y = 0 is a horizontal asymptote
If deg num = deg denom, y = L is a horizontal asymptote
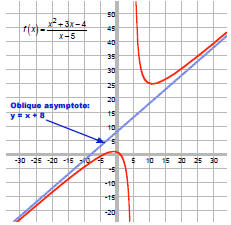
If deg num = deg denom + 1, use long division to find oblique asymptote, y = mx
+ b
5. Plot where the graph crosses a horizontal or oblique asymptote, if it does.
That is, solve
the equation:
Function = asymptote
R(x) = y
6. If needed, plot a few extra points.
7. Connect the dots.
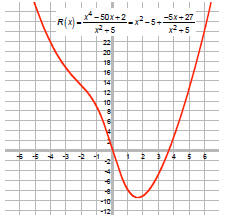
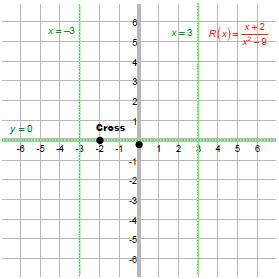
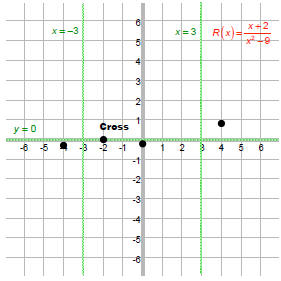
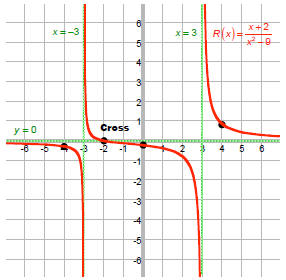
Ex: Graph
1. Factor, state domain, and THEN reduce.
Domain:
Cannot reduce.
2. Plot intercepts. For x-intercepts, state whether graph
touches (multiplicity is even) or
crosses (multiplicity is odd) x-axis.
x-intercept:
The factor x + 2 has multiplicity 1, which is odd, so
graph crosses here.
y-intercept:
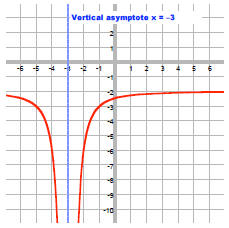
3. Draw vertical asymptotes (the zeros of the
denominator).
These occur when the denominator is 0. That is, at x = -3 and x = 3.
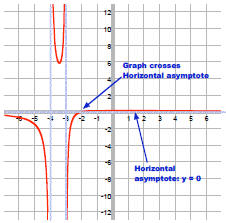
4. Draw horizontal asymptotes:
Since deg num < deg denom, HA is y = 0
5. Plot where the graph crosses a horizontal or oblique asymptote, if it does.
That is, solve
the equation:
| Solve R(x) = y |
 |
 |
So, the graph crosses the horizontal
asymptote at x = –2. |
6. If needed, plot a few extra points.
R(-4) = -0.3
R(4) = 0.9
7. Connect the dots.
|